- Community
- RUCKUS Technologies
- RUCKUS Lennar Support
- Community Services
- RTF
- RTF Community
- Australia and New Zealand – English
- Brazil – Português
- China – 简体中文
- France – Français
- Germany – Deutsch
- Hong Kong – 繁體中文
- India – English
- Indonesia – bahasa Indonesia
- Italy – Italiano
- Japan – 日本語
- Korea – 한국어
- Latin America – Español (Latinoamérica)
- Middle East & Africa – English
- Netherlands – Nederlands
- Nordics – English
- North America – English
- Poland – polski
- Russia – Русский
- Singapore, Malaysia, and Philippines – English
- Spain – Español
- Taiwan – 繁體中文
- Thailand – ไทย
- Turkey – Türkçe
- United Kingdom – English
- Vietnam – Tiếng Việt
- EOL Products
- RUCKUS Forums
- RUCKUS Technologies
- RUCKUS Self-Help
- How to monitor ES (Elastic Search) health from con...
- Subscribe to RSS Feed
- Mark Topic as New
- Mark Topic as Read
- Float this Topic for Current User
- Bookmark
- Subscribe
- Mute
- Printer Friendly Page
How to monitor ES (Elastic Search) health from controller logs and CLI?
- Mark as New
- Bookmark
- Subscribe
- Mute
- Subscribe to RSS Feed
- Permalink
- Report Inappropriate Content
01-31-2022
12:08 AM
- last edited on
09-21-2022
04:28 AM
by
![]() Anusha_Vemula
Anusha_Vemula
What is ES?
Elasticsearch is a highly scalable open-source full-text search and analytics engine. It allows you to store, search, and analyze big volumes of data quickly and in near real-time. It is generally used as the underlying engine/technology that powers applications that have complex search features and requirements." — https://www.elastic.co/guide/en/elasticsearch/reference/current/getting-started.html”
Starting from the 3.5 version, SZ/VSZ uses ES, especially for quick response for UI, needs and we have two data sources to store data. Some of them are in Cassandra (Configuration), some of them are in ES(status/stats). We rely on an underlying sync mechanism to make sure data consistency.
Why does the ES issue happen?
The problem can be separated into two parts.
- UI Not responding.
There are many reasons cause the ES cluster failed. In most cases, network partition (or unstable network connection between nodes). In such cases, we have a few ways to do recovery automatically. Configurer service can do some recovery but only try to restart the ES node.
- Data Out of sync.
Many reasons can probably fail ES, in this situation, we must check the log and deal with it in a different way. Reindex is the final solution to solve this problem. However, to confirm the problem is out of sync, usually need to manually check, not every case can be resolved by reindexing procedure.
Issues that you will notice on UI:
Pop-up error messages about ES keywords (For example: "all shards failed")
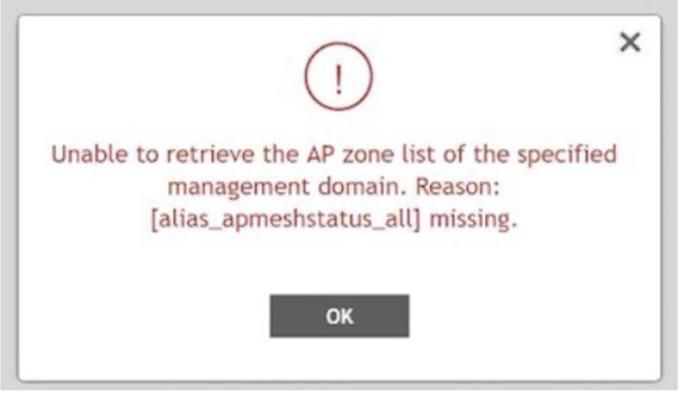
Pop-up error messages about "alias missing"
Show no result in WebGUI (For example: WLAN tab or AP tab show no result)
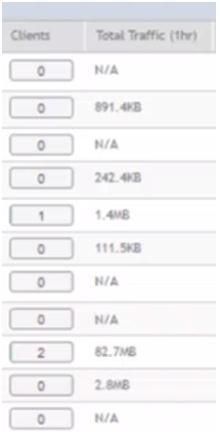
AP Traffic column or radio (2.4 or 5GHz) column would show N/A.
And sometimes, navigating between different tabs of the controller you would see “An Unknown error” occurred message.
How to identify from the logs if ES has gone bad?
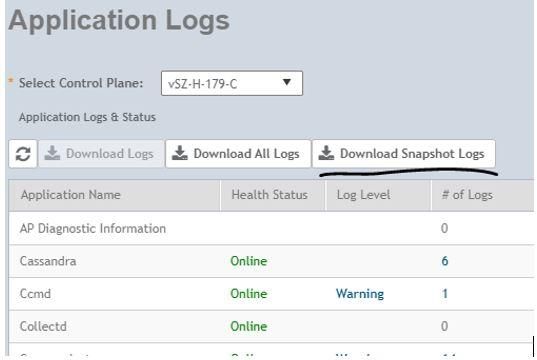
Download Snapshot logs from the SZ/vSZ, by navigating to Diagnostics > Application logs
- If Elastic Search service is offline, that could be verified by running the command “show service”
- Once you download the snapshot logs extract them using 7 zip. Then navigate to applogfiles folder, you would see all services folders of the controller.
Configurer/configurer.log
Configurer[pool-4-thread-1] INFO c.r.w.c.s.ElasticClientService - Start to initial ES client.
Configurer[pool-4-thread-1] INFO c.r.w.c.s.ElasticClientService - Failed to init ES client
org.elasticsearch.client.transport.NoNodeAvailableException: None of the configured nodes are available: []
at org.elasticsearch.client.transport.TransportClientNodesService.ensureNodesAreAvailable(TransportClientNodesService.java:305) ~[elasticsearch-1.7.2.jar:na]
at org.elasticsearch.client.transport.TransportClientNodesService.execute(TransportClientNodesService.java:200) ~[elasticsearch-1.7.2.jar:na]
at org.elasticsearch.client.transport.support.InternalTransportClusterAdminClient.execute(InternalTransportClusterAdminClient.java:86) ~[elasticsearch-1.7.2.jar:na]
Core/core.log
Caused by: org.elasticsearch.indices.IndexMissingException: [alias_apmeshstatus_all] missing
at org.elasticsearch.cluster.metadata.MetaData.convertFromWildcards(MetaData.java:884) ~[elasticsearch-1.7.2.jar:na]
at org.elasticsearch.cluster.metadata.MetaData.concreteIndices(MetaData.java:692) ~[elasticsearch-1.7.2.jar:na]
at org.elasticsearch.action.search.type.TransportSearchTypeAction$BaseAsyncAction.<init>(TransportSearchTypeAction.java:118) ~[elasticsearch-1.7.2.jar:na]
at org.elasticsearch.action.search.type.TransportSearchDfsQueryThenFetchAction$AsyncAction.<init>(TransportSearchDfsQueryThenFetchAction.java:76) ~[elasticsearch-1.7.2.jar:na]
Web/web.log
Web[localhost-startStop-2] ERROR c.r.s.d.s.r.ReIndexServiceImpl - init reindex [com.ruckuswireless.scg.domain.service.reindex.APReIndexCommand@47dda78] failed
org.elasticsearch.indices.IndexMissingException: [alias_apmeshstatus_all] missing
at org.elasticsearch.cluster.metadata.MetaData.convertFromWildcards(MetaData.java:884) ~[elasticsearch-1.7.2.jar:na]
at org.elasticsearch.cluster.metadata.MetaData.concreteIndices(MetaData.java:692) ~[elasticsearch-1.7.2.jar:na]
at org.elasticsearch.action.search.type.TransportSearchTypeAction$BaseAsyncAction.<init>(TransportSearchTypeAction.java:118) ~[elasticsearch-1.7.2.jar:na]
Configurer/es-monitor.log (search by “health” keyword), check if the health shows red or yellow.
In the same “es-monitor.log” (search by “UNASSIGNED” keyword)
index                           shard prirep state        docs   store ip           node
apcliscripthistory_20220127     1     p      STARTED         0    130b x.x.x.x 614c6b97-baa4-488e-8ace-e62b2f086855
apcliscripthistory_20220127     1     r      UNASSIGNED
apcliscripthistory_20220127     0     p      STARTED         0    130b x.x.x.x 614c6b97-baa4-488e-8ace-e62b2f086855
apcliscripthistory_20220127     0     r      UNASSIGNED
From version, 5.2 onwards, we can check the ES health status from the controller CLI:
vSZ-H-179#debug

vSZ-H-179(debug)# debug-tools

[Change to system]

Welcome to Debug CLI Framework!

(debug tool-set) system $ use sz

[Change to sz]

(debug tool-set) sz $ ?

Debug Tools (sz):

Command          Help

================ ================================
show-es-cat-aliases show ES cat aliases info
show-es-cat-health show ES cat health info
show-es-cat-indices show ES cat indices info
show-es-cat-master show ES cat master info
show-es-cat-nodes show ES cat nodes info
show-es-cat-shards show ES cat shards info
show-es-cluster-settings show ES cluster settings
show-es-folder-info show ES folder info
For example: If you want to check the ES health, you could run the below command. If it shows “green” and 100% then ES health is fine. If it shows “red” or “yellow”, then ES has gone bad.
(debug tool-set) sz $ show-es-cat-health
epoch      timestamp cluster      status node.total node.data shards pri relo init unassign pending_tasks max_task_wait_time active_shards_percent
1643352441 06:47:21  vSZ-H-179_54 green           2         2    472 236    0    0        0             0                  -                100.0%
To check if the Indexes are in an UNASSIGNED state or not, if it shows like below then ES is OK.
(debug tool-set) sz $ show-es-cat-shards
*** Unknown syntax: show-es-cat-shards
index                           shard prirep state   docs  store ip            node
hccdclientconnection_20220128   1     r      STARTED    0   130b x.x.x.x bbf54faf-508b-44a3-8804-76a1b5da4b2d
If it shows like below then ES is not OK:
index                           shard prirep state        docs   store ip           node
apcliscripthistory_20220127     1     p      STARTED         0    130b x.x.x.x 614c6b97-baa4-488e-8ace-e62b2f086855
apcliscripthistory_20220127     1     r      UNASSIGNED
A brief note on INDEX and SHARDs:
Index
An INDEX is a collection of documents that have somewhat similar characteristics. It is identified by a name and this name is used to refer to the index when performing indexing, search, update, and delete operations against the documents in it. In a single cluster, you can define as many indexes as you want.
Shards
An index can potentially store a large amount of data that can exceed the hardware limits of a single node. To solve this problem, Elasticsearch provides the ability to subdivide your index into multiple pieces called SHARDS. Each shard is in itself a fully functional and independent "index" that can be hosted on any node in the cluster.
Troubleshooting:
If Elastic Search service is offline, then perform below: (plan a downtime)
Follow the below steps when the Controller is running on 3.5.1.x firmware
- Execute the below command in the debug mode to recover the Elastic Search service on the vSZ-E/SZ-100.
SZ-100(debug)#force-recover-escluster
SZ-100(debug)#reload now
Follow the below commands for controller running from 3.6.x and above
You don't have to go to debug mode in here.
SZ-100# force-recover-escluster
SZ-100# reload now
Once the Controller is online, check if all the data is available or not. If there is any data missing, execute the following command to recover the data.
SZ-100(debug)#reindex-elasticsearch-all
If Elastic Search service is not offline, and still you see some of the Data missing on UI or the errors as shown in the screenshot earlier, then only perform
SZ-100(debug)#reindex-elasticsearch-all
This command needs to be performed on individual nodes in the cluster one after another and does not require downtime. If the above-mentioned Troubleshooting steps still do not help in recovering the ES or the Data on UI, then reach out to TAC. There are certain commands that need to be run from the shell of the controller to recover the ES.
Hope the above article helps you in identifying the Elastic Search-related issues and resolving them.
Cheers!!
Happy Learning!!
- Labels:
-
RUCKUS Self-Help
-
AAA
2 -
Access points
48 -
Analytics
3 -
AP Certificate error
1 -
AP Controller Connectivity
5 -
AP Management
8 -
AP migration
1 -
AP reporting
1 -
API
2 -
Authentication Server
2 -
Client Management
1 -
Cloud
20 -
Cloud ICX
1 -
Cloudpath
23 -
Cluster synchronization
1 -
Deployment
2 -
Firmware Recommendation
1 -
Firmware Upgrade
5 -
Guest Access
2 -
ICX
73 -
ICX Switch Management
7 -
Installation
5 -
IoT
1 -
Licensing
1 -
Mobile Apps
2 -
Monitoring
1 -
Poe
2 -
RADIUS
2 -
Ruckus Cloud
1 -
RUCKUS Self-Help
209 -
Security
6 -
SmartZone or vSZ
64 -
Stacking
1 -
SZ ICX Connectivity
1 -
Traffic Management-
1 -
UMM
3 -
Unleashed
15 -
User Management
1 -
Venue Management
1 -
Wired Throughput
2 -
Wireless Throughput
1 -
WLAN Management
5 -
ZoneDirector
15
- « Previous
- Next »


