This website uses cookies. By clicking Accept, you consent to the use of cookies. Click Here to learn more about how we use cookies.
RUCKUS Community Forums are now in READ-ONLY mode while we migrate to a new platform.
You will still be able to read posts and knowledge articles, but will be unable to post new content until Go Live on the new platform Monday August 17.
Lennar Smart Home customers: please contact [email protected] for assistance during the week of August 9-17.

- Community
- RUCKUS Technologies
- RUCKUS Lennar Support
- Community Services
- RTF
- RTF Community
- Australia and New Zealand – English
- Brazil – Português
- China – 简体中文
- France – Français
- Germany – Deutsch
- Hong Kong – 繁體中文
- India – English
- Indonesia – bahasa Indonesia
- Italy – Italiano
- Japan – 日本語
- Korea – 한국어
- Latin America – Español (Latinoamérica)
- Middle East & Africa – English
- Netherlands – Nederlands
- Nordics – English
- North America – English
- Poland – polski
- Russia – Русский
- Singapore, Malaysia, and Philippines – English
- Spain – Español
- Taiwan – 繁體中文
- Thailand – ไทย
- Turkey – Türkçe
- United Kingdom – English
- Vietnam – Tiếng Việt
- EOL Products
Turn on suggestions
Auto-suggest helps you quickly narrow down your search results by suggesting possible matches as you type.
Showing results for
- RUCKUS Forums
- RUCKUS Technologies
- SZ / vSZ
- Re: Does anyone know where the Airtime Detail butt...
Options
- Subscribe to RSS Feed
- Mark Topic as New
- Mark Topic as Read
- Float this Topic for Current User
- Bookmark
- Subscribe
- Mute
- Printer Friendly Page

Options
- Mark as New
- Bookmark
- Subscribe
- Mute
- Subscribe to RSS Feed
- Permalink
- Report Inappropriate Content
07-19-2023 07:32 AM - edited 07-19-2023 07:33 AM
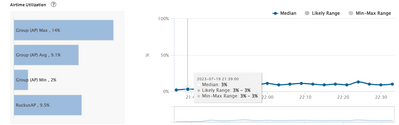
We just upgraded from 6.1 to 6.1.1 last night and this button seems to be missing from the AP -> Health airtime graph. The pie chart it opened up was really useful for determining if an AP was having high CCA/Utilization just from itself being busy or if it was caused by other neighbour networks and/or interference.
Solved! Go to Solution.
Labels:
- Labels:
-
SmartZone
-
SmartZone or vSZ
1 ACCEPTED SOLUTION

Options
- Mark as New
- Bookmark
- Subscribe
- Mute
- Subscribe to RSS Feed
- Permalink
- Report Inappropriate Content
07-19-2023 10:19 AM
Hi @Greg_WiGuy
Thank you for writing to us.
The Airtime Detail option was deprecated due to a bug that was showing the wrong statistics numbers on the output. The fix is deferred to 7.0.
Regards,
Vasanth Edward
Reply
3 REPLIES 3

Options
- Mark as New
- Bookmark
- Subscribe
- Mute
- Subscribe to RSS Feed
- Permalink
- Report Inappropriate Content
07-19-2023 10:12 AM
Hello @Greg_WiGuy
Could you please confirm if you are asking about the below Airtime graph on the SZ 6.1.1 ? Please confirm which SZ model you are using ?
Options
- Mark as New
- Bookmark
- Subscribe
- Mute
- Subscribe to RSS Feed
- Permalink
- Report Inappropriate Content
07-20-2023 04:06 AM
Hi Ayush,
I think Vasanth's response below is what I was looking for.
Options
- Mark as New
- Bookmark
- Subscribe
- Mute
- Subscribe to RSS Feed
- Permalink
- Report Inappropriate Content
07-19-2023 10:19 AM
Hi @Greg_WiGuy
Thank you for writing to us.
The Airtime Detail option was deprecated due to a bug that was showing the wrong statistics numbers on the output. The fix is deferred to 7.0.
Regards,
Vasanth Edward
Reply

Labels
-
9210
1 -
AD
1 -
AP Controller Connectivity
2 -
AP Management
5 -
AP reporting
1 -
API Help
1 -
Client Management
4 -
er
1 -
Google
1 -
Guest Access
3 -
ICX Switch Management
1 -
IP Multicast
1 -
Proposed Solution
3 -
RADIUS
2 -
RUCKUS Self-Help
8 -
SmartZone
4 -
SmartZone or vSZ
6 -
Social Media
1 -
Solution Proposed
3 -
string
1 -
SZ ICX Connectivity
1 -
Traffic Management-
1 -
User Management
2 -
vSZ
2 -
Wifi
1 -
WLAN Management
2
- « Previous
- Next »
