- Community
- RUCKUS Technologies
- RUCKUS Lennar Support
- Community Services
- RTF
- RTF Community
- Australia and New Zealand – English
- Brazil – Português
- China – 简体中文
- France – Français
- Germany – Deutsch
- Hong Kong – 繁體中文
- India – English
- Indonesia – bahasa Indonesia
- Italy – Italiano
- Japan – 日本語
- Korea – 한국어
- Latin America – Español (Latinoamérica)
- Middle East & Africa – English
- Netherlands – Nederlands
- Nordics – English
- North America – English
- Poland – polski
- Russia – Русский
- Singapore, Malaysia, and Philippines – English
- Spain – Español
- Taiwan – 繁體中文
- Thailand – ไทย
- Turkey – Türkçe
- United Kingdom – English
- Vietnam – Tiếng Việt
- EOL Products
- RUCKUS Forums
- RUCKUS Technologies
- SZ / vSZ
- Re: APs viewing on Smartzone
- Subscribe to RSS Feed
- Mark Topic as New
- Mark Topic as Read
- Float this Topic for Current User
- Bookmark
- Subscribe
- Mute
- Printer Friendly Page
APs viewing on Smartzone
- Mark as New
- Bookmark
- Subscribe
- Mute
- Subscribe to RSS Feed
- Permalink
- Report Inappropriate Content
03-15-2023 06:20 AM
I have 30 access point connected to a ruckus Smartzone 104. All APs have joined the controller and working as expected. From the Smartzone controller I only see 2 APs on the Access point monitoring side instead of 30.
Any idea how to fix this?
- Mark as New
- Bookmark
- Subscribe
- Mute
- Subscribe to RSS Feed
- Permalink
- Report Inappropriate Content
03-15-2023 09:46 AM
Hi @Tiny_Syfy ,
Greetings!
Please help me with below queries for further analysis:
- Could you confirm if this is a new setup or the SZ was showing the APs before and not displaying it now?
- Could you SSH into anyone of the AP that's not showing on SZ and verify the connection using the below command?
- get version
- get scg
- get sshtunnel
- Could you SSH into the SZ and run the below command to verify the list of all the APs in the zone from CLI?
- enable
- show zone "<Name of the zone inside Quotes>" ap
- Mark as New
- Bookmark
- Subscribe
- Mute
- Subscribe to RSS Feed
- Permalink
- Report Inappropriate Content
03-15-2023 07:26 PM
Hi @Tiny_Syfy ,
Greetings!
Restore configuration information from Cassandra to ES: In some cases, the issue may just be related to configuration out of sync so forcing to get the information from Cassandra can solve it. Please execute the command on controller CLI global mode and check behavior.
LAB1# debug

LAB1(debug)# reindex-elasticsearch-all
Start to reindex ElasticSearch, may need few minutes...
Successful operation
Thank you
Regards,
Sunil Acharya
- Mark as New
- Bookmark
- Subscribe
- Mute
- Subscribe to RSS Feed
- Permalink
- Report Inappropriate Content
03-15-2023 10:06 PM
Hi @Tiny_Syfy
If you are not seeing the AP list under the Access Points tab, ensure that the APs are properly connected to the controller.
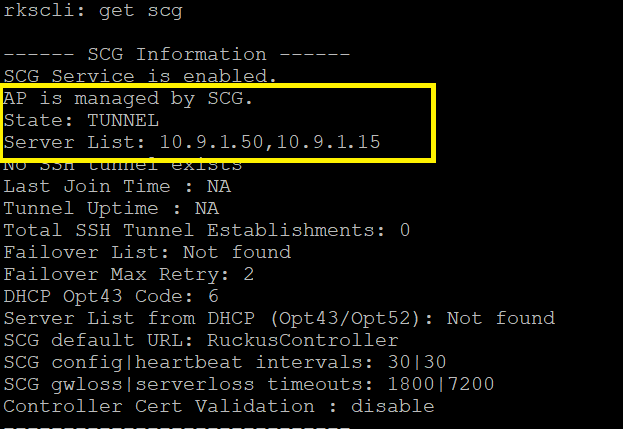
Login to the AP CLI (SSH) and check if the AP is connected to the controller. You should see similar output as below, where is should say "AP is managed by SCG", State : Tunnel or RUN, Server List : Controller IP address.
If you are seeing the similar details, then check in the SZ CLI to see if the APs are connected:
- show zone "<Name of the zone inside Quotes>" ap
If you see the output on the CLI, then it could be that the GUI is not refreshed yet, use the below command on the controller which will refresh the GUI.
LAB1# debug

LAB1(debug)# reindex-elasticsearch-all
Start to reindex ElasticSearch, may need few minutes...
Successful operation
If you are not seeing the similar details then the APs are yet to completely connect to the controller. Please share the below outputs
"get scg"
-
9210
1 -
AD
1 -
AP Controller Connectivity
2 -
AP Management
5 -
AP reporting
1 -
API Help
1 -
Client Management
4 -
er
1 -
Google
1 -
Guest Access
3 -
ICX Switch Management
1 -
IP Multicast
1 -
Proposed Solution
3 -
RADIUS
2 -
RUCKUS Self-Help
8 -
SmartZone
4 -
SmartZone or vSZ
6 -
Social Media
1 -
Solution Proposed
3 -
string
1 -
SZ ICX Connectivity
1 -
Traffic Management-
1 -
User Management
2 -
vSZ
2 -
Wifi
1 -
WLAN Management
2
- « Previous
- Next »


