This website uses cookies. By clicking Accept, you consent to the use of cookies. Click Here to learn more about how we use cookies.
- Community
- RUCKUS Technologies
- RUCKUS Lennar Support
- Community Services
- RTF
- RTF Community
- Australia and New Zealand – English
- Brazil – Português
- China – 简体中文
- France – Français
- Germany – Deutsch
- Hong Kong – 繁體中文
- India – English
- Indonesia – bahasa Indonesia
- Italy – Italiano
- Japan – 日本語
- Korea – 한국어
- Latin America – Español (Latinoamérica)
- Middle East & Africa – English
- Netherlands – Nederlands
- Nordics – English
- North America – English
- Poland – polski
- Russia – Русский
- Singapore, Malaysia, and Philippines – English
- Spain – Español
- Taiwan – 繁體中文
- Thailand – ไทย
- Turkey – Türkçe
- United Kingdom – English
- Vietnam – Tiếng Việt
- EOL Products
Turn on suggestions
Auto-suggest helps you quickly narrow down your search results by suggesting possible matches as you type.
Showing results for
- RUCKUS Forums
- RUCKUS Technologies
- SZ / vSZ
- Re: Unexpected CPU spikes and average on vSZ-H
Options
- Subscribe to RSS Feed
- Mark Topic as New
- Mark Topic as Read
- Float this Topic for Current User
- Bookmark
- Subscribe
- Mute
- Printer Friendly Page
Unexpected CPU spikes and average on vSZ-H
Options
- Mark as New
- Bookmark
- Subscribe
- Mute
- Subscribe to RSS Feed
- Permalink
- Report Inappropriate Content
02-15-2017 05:12 AM
Dear all,
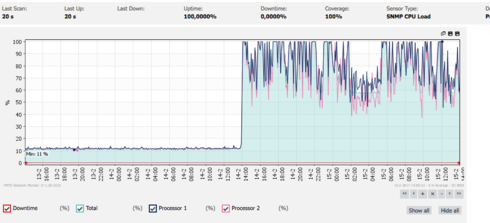
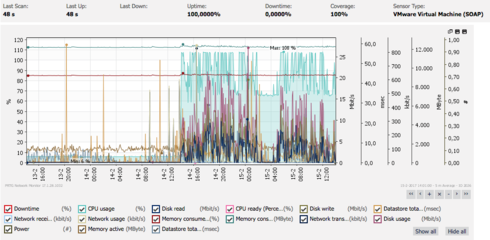
Problem: Since yesterday afternoon, we've been getting a lot of monitoring alerts because of the CPU util of our vSZ. It's been peaking a lot around 100%, but also the average is way up whereas it used to be between 11 and 17%. The screenshots below are by the vSZ itself, then CPU SNMP stats in our monitoring system and the third one of our VmWare SNMP, which shows that the vSZ utilizes extra CPU cycles (over 100%) available to the vm.
Impact: slower response and a lot of alerting. Haven't noticed major performance hits in terms of managed wireless networks.
What changed?: We've added two R500's for our lab set-up to do some testing with roaming over several different WAN connections.
AP's have all been provisioned and received the config. So I don't understand what the vSZ is still doing.
Anyone got any idea where to start looking?
Kind regards.


Problem: Since yesterday afternoon, we've been getting a lot of monitoring alerts because of the CPU util of our vSZ. It's been peaking a lot around 100%, but also the average is way up whereas it used to be between 11 and 17%. The screenshots below are by the vSZ itself, then CPU SNMP stats in our monitoring system and the third one of our VmWare SNMP, which shows that the vSZ utilizes extra CPU cycles (over 100%) available to the vm.
show cpuinfo
p.p1 {margin: 0.0px 0.0px 0.0px 0.0px; font: 11.0px Menlo; color: #000000; background-color: #ffffff} span.s1 {font-variant-ligatures: no-common-ligatures} span.Apple-tab-span {white-space:pre}
processor : 0
model name : Intel(R) Xeon(R) CPU X3430 @ 2.40GHz
processor : 1
model name : Intel(R) Xeon(R) CPU X3430 @ 2.40GHz
Cpu(s): 7.8%us, 3.6%sy, 0.0%ni, 88.4%id, 0.1%wa, 0.0%hi, 0.1%si, 0.0%st
Impact: slower response and a lot of alerting. Haven't noticed major performance hits in terms of managed wireless networks.
What changed?: We've added two R500's for our lab set-up to do some testing with roaming over several different WAN connections.
AP's have all been provisioned and received the config. So I don't understand what the vSZ is still doing.
Anyone got any idea where to start looking?
Kind regards.


1 REPLY 1
Options
- Mark as New
- Bookmark
- Subscribe
- Mute
- Subscribe to RSS Feed
- Permalink
- Report Inappropriate Content
02-17-2017 03:26 AM
After applying the 3.4.1 patch (coming from 3.2), the CPU has gone down averaging around 50%. The question still stands. There are 18 APs connected, 17 of which have been added to a zone and configured. This should still not raise the CPU from 11-16% to about 50% or higher on a 2 CPU with 14 GB machine.
Any guesses what this is or any idea how to get into linux core so I can take a look at the underlying processes?
Any guesses what this is or any idea how to get into linux core so I can take a look at the underlying processes?
Labels
-
9210
1 -
AD
1 -
AP Controller Connectivity
2 -
AP Management
5 -
AP reporting
1 -
API Help
1 -
Client Management
4 -
er
1 -
Google
1 -
Guest Access
3 -
ICX Switch Management
1 -
IP Multicast
1 -
Proposed Solution
3 -
RADIUS
2 -
RUCKUS Self-Help
8 -
SmartZone
4 -
SmartZone or vSZ
6 -
Social Media
1 -
Solution Proposed
3 -
string
1 -
SZ ICX Connectivity
1 -
Traffic Management-
1 -
User Management
2 -
vSZ
2 -
Wifi
1 -
WLAN Management
2
- « Previous
- Next »

