- Community
- RUCKUS Technologies
- RUCKUS Lennar Support
- Community Services
- RTF
- RTF Community
- Australia and New Zealand – English
- Brazil – Português
- China – 简体中文
- France – Français
- Germany – Deutsch
- Hong Kong – 繁體中文
- India – English
- Indonesia – bahasa Indonesia
- Italy – Italiano
- Japan – 日本語
- Korea – 한국어
- Latin America – Español (Latinoamérica)
- Middle East & Africa – English
- Netherlands – Nederlands
- Nordics – English
- North America – English
- Poland – polski
- Russia – Русский
- Singapore, Malaysia, and Philippines – English
- Spain – Español
- Taiwan – 繁體中文
- Thailand – ไทย
- Turkey – Türkçe
- United Kingdom – English
- Vietnam – Tiếng Việt
- EOL Products
- RUCKUS Forums
- RUCKUS Technologies
- ICX Switches
- ICX 6610 high cpu usage
- Subscribe to RSS Feed
- Mark Topic as New
- Mark Topic as Read
- Float this Topic for Current User
- Bookmark
- Subscribe
- Mute
- Printer Friendly Page
ICX 6610 high cpu usage
- Mark as New
- Bookmark
- Subscribe
- Mute
- Subscribe to RSS Feed
- Permalink
- Report Inappropriate Content
11-04-2019 11:08 AM
We have a pair of ICX 6610 stacked and both of them are running version 08.0.30tT7f3 (latest).
We are facing a very strange behavior with these boxes. The latency for all IPs configured in it, when we ping, returns with high latency even locally.
Below you can find two examples of the problem that we are facing.
##########################
marceloaraujo@CT-REDES-02[19:55][~]: ping 191.252.191.1
PING 191.252.191.1 (191.252.191.1) 56(84) bytes of data.
64 bytes from 191.252.191.1: icmp_seq=1 ttl=60 time=90.6 ms
64 bytes from 191.252.191.1: icmp_seq=2 ttl=60 time=230 ms
64 bytes from 191.252.191.1: icmp_seq=3 ttl=60 time=1.69 ms
64 bytes from 191.252.191.1: icmp_seq=4 ttl=60 time=3.59 ms
64 bytes from 191.252.191.1: icmp_seq=5 ttl=60 time=0.753 ms
PING 191.252.203.1 (191.252.203.1) 56(84) bytes of data.
64 bytes from 191.252.203.1: icmp_seq=1 ttl=60 time=1.00 ms
64 bytes from 191.252.203.1: icmp_seq=2 ttl=60 time=1.49 ms
64 bytes from 191.252.203.1: icmp_seq=3 ttl=60 time=121 ms
64 bytes from 191.252.203.1: icmp_seq=4 ttl=60 time=106 ms
Another strange thing is the CPU usage. The 1 second statistic show us spikes, may be this is the reason of latency.
###########################
65 percent busy, from 1 sec ago
1 sec avg: 65 percent busy
5 sec avg: 1 percent busy
60 sec avg: 1 percent busy
300 sec avg: 1 percent busy
spcrdc2ita001#sh cpu-utilization
Less than a second from the last call, abort
1 sec avg: 1 percent busy
5 sec avg: 1 percent busy
60 sec avg: 1 percent busy
300 sec avg: 1 percent busy
spcrdc2ita001#sh cpu-utilization
1 percent busy, from 1 sec ago
1 sec avg: 1 percent busy
5 sec avg: 1 percent busy
60 sec avg: 1 percent busy
300 sec avg: 1 percent busy
Sspcrdc2ita001#sh cpu-utilization
1 percent busy, from 39 sec ago
1 sec avg: 73 percent busy
5 sec avg: 1 percent busy
60 sec avg: 1 percent busy
300 sec avg: 1 percent busy
spcrdc2ita001#sh cpu-utilization
Less than a second from the last call, abort
1 sec avg: 7 percent busy
5 sec avg: 3 percent busy
60 sec avg: 1 percent busy
300 sec avg: 1 percent busy
When we run a "show cpu tasks" the number seems to be good, as below.
spcrdc2ita001#show cpu tasks
... Usage average for all tasks in the last 1 second ...
==========================================================
Name %
idle 9
con 0
mon 0
flash 0
dbg 0
boot 0
main 0
stkKeepAlive 0
keygen 0
itc 0
poeFwdfsm 0
tmr 0
scp 0
appl 91
snms 0
rtm 0
rtm6 0
rip 0
bgp 0
bgp_io 0
ospf 0
ospf_r_calc 0
openflow_ofm 0
openflow_opm 0
mcast_fwd 0
mcast 0
msdp 0
ripng 0
ospf6 0
ospf6_rt 0
mcast6 0
ipsec 0
dhcp6 0
snmp 0
rmon 0
web 0
acl 0
flexauth 0
ntp 0
rconsole 0
console 0
ospf_msg_task 0
ssh_0 0
All the interfaces are fine (bandwidth consumption is low) and we have no problems with PPS (Packets per second) rate.
You can find an image from our monitoring tool with CPU,Memory usage and response time.
Did anynone experience this? Do you have any suggestions for tourbleshooting/fix that?


Thanks,
Marcelo Tadeu
- Mark as New
- Bookmark
- Subscribe
- Mute
- Subscribe to RSS Feed
- Permalink
- Report Inappropriate Content
11-04-2019 11:15 AM
support.ruckuswireless.com/contact-us
- Mark as New
- Bookmark
- Subscribe
- Mute
- Subscribe to RSS Feed
- Permalink
- Report Inappropriate Content
11-04-2019 11:46 AM
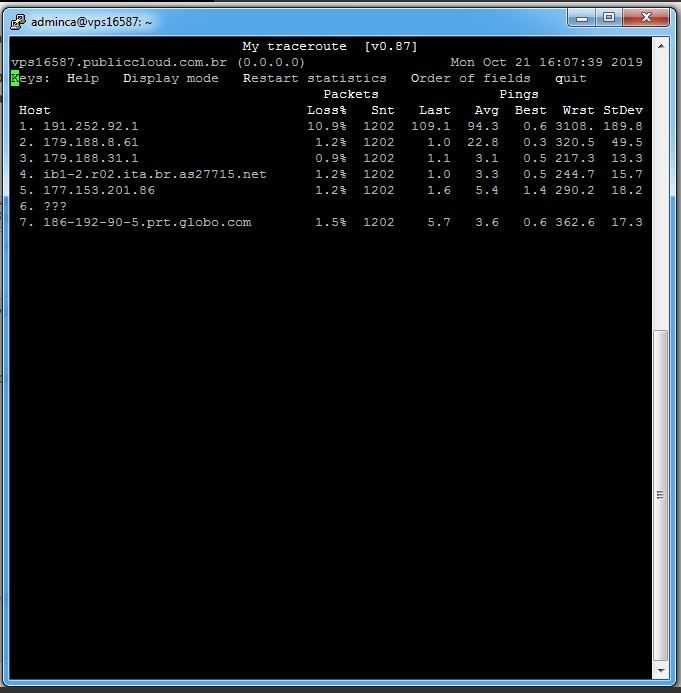
This is a MRT from the machine behind ICX going to our customer IP (inside -> outside).

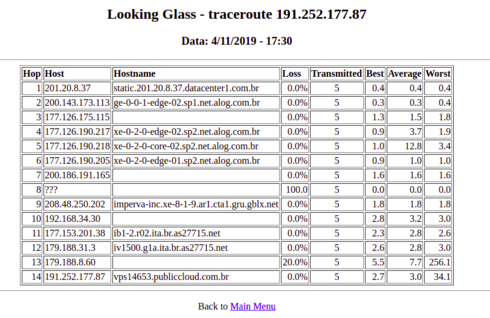
From outside to inside:


We'll open a TAC to check it out and will post the fix here.
Thanks for attention.
Regards,
Marcelo Tadeu
- Mark as New
- Bookmark
- Subscribe
- Mute
- Subscribe to RSS Feed
- Permalink
- Report Inappropriate Content
12-09-2019 12:02 PM
- Mark as New
- Bookmark
- Subscribe
- Mute
- Subscribe to RSS Feed
- Permalink
- Report Inappropriate Content
12-13-2019 06:52 PM
Since the only change I made was generating the crypto keys for SSH, I zeroize'd that out... Similar network load testing and it's not happening now. Not sure what the deal is. Anyone else have this issue or have a resolution?
Copyright (c) 1996-2016 Brocade Communications Systems, Inc. All rights reserved.
UNIT 1: compiled on Feb 13 2019 at 18:30:50 labeled as FCXR08030t
(10545807 bytes) from Primary FCXR08030t.bin
SW: Version 08.0.30tT7f3
UNIT 2: compiled on Feb 13 2019 at 18:30:50 labeled as FCXR08030t
(10545807 bytes) from Primary FCXR08030t.bin
SW: Version 08.0.30tT7f3
Boot-Monitor Image size = 370695, Version:10.1.00T7f5 (grz10100)-
7250
1 -
802.3af PoE
1 -
802.3at PoE
1 -
AAA
1 -
ACL
1 -
auto-provision
1 -
auto-provisioning
1 -
Cluster synchronization
1 -
Crypto Keys
1 -
Deployment
1 -
dhcp-66
1 -
fastiron-10
1 -
fastiron-8
1 -
Firmware Upgrade
4 -
ICX
3 -
ICX 7150-C12p
1 -
ICX switch
2 -
ICX Switch Management
9 -
ICX-7150-C12
1 -
ICX-7550
1 -
ICX-8200
1 -
Installation
2 -
not enough electricity
1 -
overlad
1 -
Override PoE Operating Mode
1 -
PD overload
1 -
Poe
2 -
PoE mode.
1 -
power limitations
1 -
Proposed Solution
1 -
RADIUS
1 -
Routing
2 -
RUCKUS Self-Help
2 -
stack
1 -
stack password
1 -
Stacking
1 -
tftp
1 -
Upgrade
1 -
Upgrade path
1 -
We
1 -
zero-touch
1
- « Previous
- Next »

