This website uses cookies. By clicking Accept, you consent to the use of cookies. Click Here to learn more about how we use cookies.
- Community
- RUCKUS Technologies
- RUCKUS Lennar Support
- Community Services
- RTF
- RTF Community
- Australia and New Zealand – English
- Brazil – Português
- China – 简体中文
- France – Français
- Germany – Deutsch
- Hong Kong – 繁體中文
- India – English
- Indonesia – bahasa Indonesia
- Italy – Italiano
- Japan – 日本語
- Korea – 한국어
- Latin America – Español (Latinoamérica)
- Middle East & Africa – English
- Netherlands – Nederlands
- Nordics – English
- North America – English
- Poland – polski
- Russia – Русский
- Singapore, Malaysia, and Philippines – English
- Spain – Español
- Taiwan – 繁體中文
- Thailand – ไทย
- Turkey – Türkçe
- United Kingdom – English
- Vietnam – Tiếng Việt
- EOL Products
Turn on suggestions
Auto-suggest helps you quickly narrow down your search results by suggesting possible matches as you type.
Showing results for
- RUCKUS Forums
- RUCKUS Technologies
- ZD
- Re: Anyone using Cacti?
Options
- Subscribe to RSS Feed
- Mark Topic as New
- Mark Topic as Read
- Float this Topic for Current User
- Bookmark
- Subscribe
- Mute
- Printer Friendly Page
Anyone using Cacti?
Options
- Mark as New
- Bookmark
- Subscribe
- Mute
- Subscribe to RSS Feed
- Permalink
- Report Inappropriate Content
06-20-2013 07:17 AM
I am running Cacti for monitoring our network, and would like to monitor the Zone Director as well. What I'm running into is that there are no Cacti templates out there and I'm not comfortable building my own. Has anybody built a Cacti template that monitors the ZD or APs?
64 REPLIES 64
Options
- Mark as New
- Bookmark
- Subscribe
- Mute
- Subscribe to RSS Feed
- Permalink
- Report Inappropriate Content
10-01-2015 07:11 PM
Hi Joel,
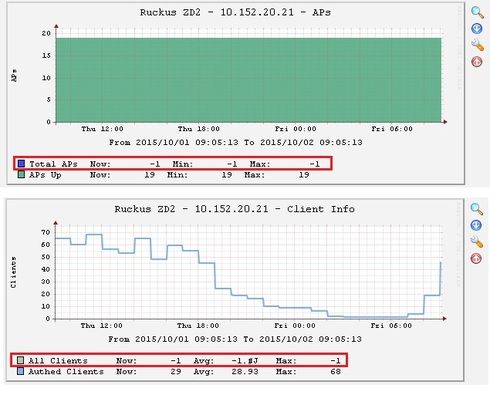
Thank you about your suggestion. The problem has been fix since I change the CF Type from "LAST" to "AVERAGE".
But I have found some unactive OID, I did snmpwalk but the result was not OK. So, it make the graphs didn't display properly.

The OID is:
APs Total - result: NOK 1.3.6.1.4.1.25053.1.2.1.1.1.15.15.0
All Clients - result: NOK 1.3.6.1.4.1.25053.1.2.1.1.1.15.30.0
Do you know how to fix it? I tried looking the SNMP OID from ruckus SNMP reference guide, but I have not found yet which OID should be used.
Thanks,
Thank you about your suggestion. The problem has been fix since I change the CF Type from "LAST" to "AVERAGE".
But I have found some unactive OID, I did snmpwalk but the result was not OK. So, it make the graphs didn't display properly.

The OID is:
APs Total - result: NOK 1.3.6.1.4.1.25053.1.2.1.1.1.15.15.0
All Clients - result: NOK 1.3.6.1.4.1.25053.1.2.1.1.1.15.30.0
Do you know how to fix it? I tried looking the SNMP OID from ruckus SNMP reference guide, but I have not found yet which OID should be used.
Thanks,
Options
- Mark as New
- Bookmark
- Subscribe
- Mute
- Subscribe to RSS Feed
- Permalink
- Report Inappropriate Content
10-05-2015 08:26 AM
I don't have much of an idea of what is wrong with the graphs you show as mine do not have this problem. I'm not an SNMP/Cacti expert and also do not know what "NOK" means as a result.
Sorry I can't be more help.
-Joel
Sorry I can't be more help.
-Joel
Options
- Mark as New
- Bookmark
- Subscribe
- Mute
- Subscribe to RSS Feed
- Permalink
- Report Inappropriate Content
10-09-2015 12:15 AM
Yes, the graph is showing normal in my ZD ver 1100 but not in ZD1000. And I thought that is also working normal for ZD1100 above version, cmiiw
I didnt know why that could be happened, Then i did snmpwalk of these APs Total OID 1.3.6.1.4.1.25053.1.2.1.1.1.15.15.0 and All Clients OID 1.3.6.1.4.1.25053.1.2.1.1.1.15.30.0. And the result was Not OK, "NOK".
Sorry for misunderstanding.
So, now i am still looking for exact for those OID.
Maybe someone here knows how to work with that issue?
Options
- Mark as New
- Bookmark
- Subscribe
- Mute
- Subscribe to RSS Feed
- Permalink
- Report Inappropriate Content
05-04-2016 07:21 AM
Hi everyone,
we have been using Cacti for over a year now to monitor our ZD1200's. As we have recently started using the Smartzone 100 as well. I wanted to monitor it with Cacti.
I have successfully made a template for the SZ100 with FW 3.1 and later.
A link to the profile on our website:
www.padaco.nl/cacti_host_template_ruckus_sz100.xml
It can render data about the total registered APs and total concurrent stations/clients.
Sadly there is no SNMP data entry for the amount of connected APs or Root/Mesh APs, otherwise I could add those to give more differentiation.
Options
- Mark as New
- Bookmark
- Subscribe
- Mute
- Subscribe to RSS Feed
- Permalink
- Report Inappropriate Content
02-12-2018 06:57 AM
Hi all!
Does anybody can share the ruckus template for cacti?
In this topic I found 2 links, but none of them works.
First link: https://forums.cacti.net/viewtopic.php?f=12&t=53270
Second link: http://siaiota02.univali.br/odilo/cacti/cacti.zip
Does anybody can share the ruckus template for cacti?
In this topic I found 2 links, but none of them works.
First link: https://forums.cacti.net/viewtopic.php?f=12&t=53270
Second link: http://siaiota02.univali.br/odilo/cacti/cacti.zip
Labels
-
DHCP
1 -
IP lease
1 -
license snmp
1 -
Proposed Solution
1 -
Ruckus
1 -
server
1 -
VLAN
1 -
wap
1 -
zone director
1 -
ZoneDirector
1

