This website uses cookies. By clicking Accept, you consent to the use of cookies. Click Here to learn more about how we use cookies.
- Community
- RUCKUS Technologies
- RUCKUS Lennar Support
- Community Services
- RTF
- RTF Community
- Australia and New Zealand – English
- Brazil – Português
- China – 简体中文
- France – Français
- Germany – Deutsch
- Hong Kong – 繁體中文
- India – English
- Indonesia – bahasa Indonesia
- Italy – Italiano
- Japan – 日本語
- Korea – 한국어
- Latin America – Español (Latinoamérica)
- Middle East & Africa – English
- Netherlands – Nederlands
- Nordics – English
- North America – English
- Poland – polski
- Russia – Русский
- Singapore, Malaysia, and Philippines – English
- Spain – Español
- Taiwan – 繁體中文
- Thailand – ไทย
- Turkey – Türkçe
- United Kingdom – English
- Vietnam – Tiếng Việt
- EOL Products
Turn on suggestions
Auto-suggest helps you quickly narrow down your search results by suggesting possible matches as you type.
Showing results for
- RUCKUS Forums
- RUCKUS Technologies
- ZD
- Re: Anyone using Cacti?
Options
- Subscribe to RSS Feed
- Mark Topic as New
- Mark Topic as Read
- Float this Topic for Current User
- Bookmark
- Subscribe
- Mute
- Printer Friendly Page
Anyone using Cacti?
Options
- Mark as New
- Bookmark
- Subscribe
- Mute
- Subscribe to RSS Feed
- Permalink
- Report Inappropriate Content
06-20-2013 07:17 AM
I am running Cacti for monitoring our network, and would like to monitor the Zone Director as well. What I'm running into is that there are no Cacti templates out there and I'm not comfortable building my own. Has anybody built a Cacti template that monitors the ZD or APs?
64 REPLIES 64
Options
- Mark as New
- Bookmark
- Subscribe
- Mute
- Subscribe to RSS Feed
- Permalink
- Report Inappropriate Content
05-03-2017 12:20 PM
Poderia enviar para leandro@tifloripa.com.br.. Obrigado
Options
- Mark as New
- Bookmark
- Subscribe
- Mute
- Subscribe to RSS Feed
- Permalink
- Report Inappropriate Content
08-21-2013 06:43 AM
Guys, I believe it's better if you could just download the templates on this link: http://siaiota02.univali.br/odilo/cac...
Let me know if you are able to download them. I will let the link online for some days..
---
How to:
Try to import the files to Cacti on the “Import templates” option, Console tab -> Import/Export.
I don’t know why but when I was exporting the Host template of Ruckus ZD 3000 I got an error on Cacti and was not able to export. But it is easy to create one after you import the files attached.
At the Console tab, click on Host Templates option and add a new one:
- Set a useful name for the host template.
- Associate 2 graphs to it:
Ruckus ZD 3000 – Clients
Ruckus ZD 3000 – CPU
- Associate one data query type:
SNMP - Interface Statistics
It will look like the image bellow:

After that you need just to add your devices and create/customize your graphs.
Just another thing, I opened a case with Ruckus support for help with Cacti templates, MIBs etc., and after a while I gave up and just did my way..
I was not able to collect data using SNMPv3 😞 still don't know why and I didn't had much time to try it again as we needed the information at the time.. so, I'm still using SNMPv2 to collect data 😕 but it's graphing.. 🙂 I'll work on that later..
Let me know if you are able to download them. I will let the link online for some days..
---
How to:
Try to import the files to Cacti on the “Import templates” option, Console tab -> Import/Export.
I don’t know why but when I was exporting the Host template of Ruckus ZD 3000 I got an error on Cacti and was not able to export. But it is easy to create one after you import the files attached.
At the Console tab, click on Host Templates option and add a new one:
- Set a useful name for the host template.
- Associate 2 graphs to it:
Ruckus ZD 3000 – Clients
Ruckus ZD 3000 – CPU
- Associate one data query type:
SNMP - Interface Statistics
It will look like the image bellow:

After that you need just to add your devices and create/customize your graphs.
Just another thing, I opened a case with Ruckus support for help with Cacti templates, MIBs etc., and after a while I gave up and just did my way..
I was not able to collect data using SNMPv3 😞 still don't know why and I didn't had much time to try it again as we needed the information at the time.. so, I'm still using SNMPv2 to collect data 😕 but it's graphing.. 🙂 I'll work on that later..
Options
- Mark as New
- Bookmark
- Subscribe
- Mute
- Subscribe to RSS Feed
- Permalink
- Report Inappropriate Content
03-22-2014 02:21 PM
This is amazing! Thanks so much for sharing. Worked great for me today.
Options
- Mark as New
- Bookmark
- Subscribe
- Mute
- Subscribe to RSS Feed
- Permalink
- Report Inappropriate Content
09-12-2013 07:09 AM
Hello,
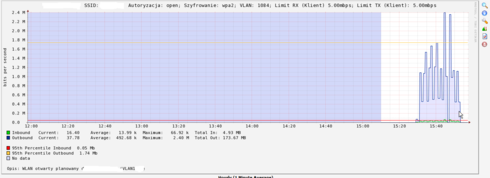
I've also constructed today cool monitoring using Cacti. Of course it is about to be modernized according to further needs, but it already satisfies what is missing in ZD interface: breakdown of traffic per SSID and historic number of users per SSID.
Both numbers can be important for customers.
Most important is the XML itself - I pool for OIDS:
1.3.6.1.4.1.25053.1.2.2.1.1.1.1.1.1
OID/REGEXP:^.{36}(.*)$
1.3.6.1.4.1.25053.1.2.2.1.1.1.1.1.1
1.3.6.1.4.1.25053.1.2.2.1.1.1.1.1.2
1.3.6.1.4.1.25053.1.2.2.1.1.1.1.1.4
1.3.6.1.4.1.25053.1.2.2.1.1.1.1.1.3
1.3.6.1.4.1.25053.1.2.2.1.1.1.1.1.7
1.3.6.1.4.1.25053.1.2.2.1.1.1.1.1.8
1.3.6.1.4.1.25053.1.2.2.1.1.1.1.1.9
1.3.6.1.4.1.25053.1.2.2.1.1.1.1.1.12
1.3.6.1.4.1.25053.1.2.2.1.1.1.1.1.16
1.3.6.1.4.1.25053.1.2.2.1.1.1.1.1.14
This gives information about all SSID (indexed structure) and the data can be plot into a graph like this:

Information about the name, ssid, authorization, encryption, VLAN, RX/TX limits and description are directly from ZD for each SSID. Cacti is automated to deploy graphs when there is new SSID created.
All fine since 1 hour 🙂
I've also constructed today cool monitoring using Cacti. Of course it is about to be modernized according to further needs, but it already satisfies what is missing in ZD interface: breakdown of traffic per SSID and historic number of users per SSID.
Both numbers can be important for customers.
Most important is the XML itself - I pool for OIDS:
1.3.6.1.4.1.25053.1.2.2.1.1.1.1.1.1
OID/REGEXP:^.{36}(.*)$
1.3.6.1.4.1.25053.1.2.2.1.1.1.1.1.1
1.3.6.1.4.1.25053.1.2.2.1.1.1.1.1.2
1.3.6.1.4.1.25053.1.2.2.1.1.1.1.1.4
1.3.6.1.4.1.25053.1.2.2.1.1.1.1.1.3
1.3.6.1.4.1.25053.1.2.2.1.1.1.1.1.7
1.3.6.1.4.1.25053.1.2.2.1.1.1.1.1.8
1.3.6.1.4.1.25053.1.2.2.1.1.1.1.1.9
1.3.6.1.4.1.25053.1.2.2.1.1.1.1.1.12
1.3.6.1.4.1.25053.1.2.2.1.1.1.1.1.16
1.3.6.1.4.1.25053.1.2.2.1.1.1.1.1.14
This gives information about all SSID (indexed structure) and the data can be plot into a graph like this:

Information about the name, ssid, authorization, encryption, VLAN, RX/TX limits and description are directly from ZD for each SSID. Cacti is automated to deploy graphs when there is new SSID created.
All fine since 1 hour 🙂
Options
- Mark as New
- Bookmark
- Subscribe
- Mute
- Subscribe to RSS Feed
- Permalink
- Report Inappropriate Content
03-22-2014 02:21 PM
I've got the basic stuff from Odilo imported and it's working great. I'd love to add the per-SSID user counts you mention here, but I'm VERY new to Cacti and I'm not having luck deciphering how to accomplish what you've shown here. I think I understand the need to create a new Query XML but haven't figured out how to accomplish that. Any chance you could share your templates or provide some explanation on how to create them?
Labels
-
DHCP
1 -
IP lease
1 -
license snmp
1 -
Proposed Solution
1 -
Ruckus
1 -
server
1 -
VLAN
1 -
wap
1 -
zone director
1 -
ZoneDirector
1

