- Community
- RUCKUS Technologies
- RUCKUS Lennar Support
- Community Services
- RTF
- RTF Community
- Australia and New Zealand – English
- Brazil – Português
- China – 简体中文
- France – Français
- Germany – Deutsch
- Hong Kong – 繁體中文
- India – English
- Indonesia – bahasa Indonesia
- Italy – Italiano
- Japan – 日本語
- Korea – 한국어
- Latin America – Español (Latinoamérica)
- Middle East & Africa – English
- Netherlands – Nederlands
- Nordics – English
- North America – English
- Poland – polski
- Russia – Русский
- Singapore, Malaysia, and Philippines – English
- Spain – Español
- Taiwan – 繁體中文
- Thailand – ไทย
- Turkey – Türkçe
- United Kingdom – English
- Vietnam – Tiếng Việt
- EOL Products
- RUCKUS Forums
- RUCKUS Lennar Support
- RUCKUS Support for Lennar Homes
- Re: R750 high number of % Retries and % Dropped
- Subscribe to RSS Feed
- Mark Topic as New
- Mark Topic as Read
- Float this Topic for Current User
- Bookmark
- Subscribe
- Mute
- Printer Friendly Page
R750 high number of % Retries and % Dropped
- Mark as New
- Bookmark
- Subscribe
- Mute
- Subscribe to RSS Feed
- Permalink
- Report Inappropriate Content
01-08-2022 10:09 AM
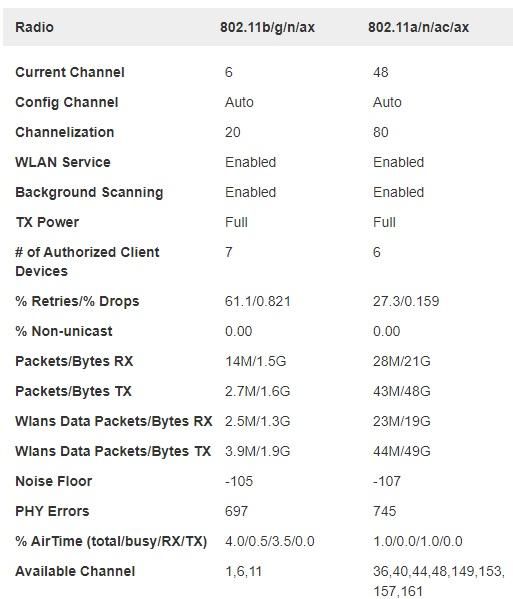
I recently upgraded two R710 to R750 (latest Unleashed), and noticed that AP Info for R750s show pretty high number of %Retries/%Dropped compared to previous R710. For R710 %Retries was 0.0001%, and Dropped was almost 0. But with R750 %Retries is around 27% (even higher for 2.4G). Also PHY errors reported in hundreds, whether in R710 it was mostly 0. There was no changes in environment or AP location.
Interesting that there is absolutely no visible impact on clients, the speed and coverage is excellent, no disconnections.
Any idea what could be causing such high number of %Retries on R750 compared o R710? Thank you!

- Mark as New
- Bookmark
- Subscribe
- Mute
- Subscribe to RSS Feed
- Permalink
- Report Inappropriate Content
01-09-2022 11:47 PM
Hi Votnet,
What was the uptime of this AP, when you took this screenshot?
Syamantak Omer
Sr.Staff TSE | CWNA | CCNA | RCWA | RASZA | RICXI
RUCKUS Networks, CommScope!
Follow me on LinkedIn
- Mark as New
- Bookmark
- Subscribe
- Mute
- Subscribe to RSS Feed
- Permalink
- Report Inappropriate Content
01-10-2022 05:53 AM
The uptime was 3 days at that time. I noticed that right after the AP reboot the retries percentage is like 800%, which is strange. But then it quickly goes down, but then stabilizes in a day or so. Now at day 4 it is 25% for 5g, and 70% for 2.4g.
Since I was really surprised with these numbers, I put one of my old R710 back, and the Retries % actually starts with 0, and doesn’t change much over time at all. Maybe R750 counting these somehow differently?
- Mark as New
- Bookmark
- Subscribe
- Mute
- Subscribe to RSS Feed
- Permalink
- Report Inappropriate Content
09-23-2022 09:25 AM - edited 09-23-2022 12:06 PM
I noticed the same thing. We had T300s originally, installed 7 years ago, which showed much higher PHY errors. After switching them out for T610s about 2 years ago, those numbers went to almost 0. We've recently begun replacing some of those with T750s, and we are seeing an increase in PHY errors, although not as high as the old T300s. There's a substantial increase in Retry and Drop %, from almost 0% each to 60% and 10%.
-
Access point
3 -
Access points
5 -
all lights blinking after reset icx 7150 switch
1 -
Amber
1 -
Amber System
2 -
AP
1 -
Boot mode
1 -
bootloader
1 -
cli
1 -
Compatibility
1 -
Console
1 -
console access
1 -
dns
1 -
eero
2 -
eps
1 -
Frontier
1 -
Green Power
2 -
Hard reset
1 -
Heartbeat
1 -
Heartbeat loss recurring
2 -
Help
2 -
Help Needed
2 -
i Al
1 -
ICX
2 -
ICX 7150-C12p
7 -
ICX switch
4 -
ICX Switch Disconnected
1 -
ICX Switch Management
4 -
ICX-7150-C12
2 -
ICX-7150-C12P
1 -
Important Announcement
1 -
Installation
1 -
Internet Issue
2 -
Ive been
1 -
Lennar
3 -
Lennar Home
2 -
Lennar homes
25 -
Management Port
1 -
NAND flash memory
1 -
New
1 -
No POE
2 -
No power via Ethernet
1 -
password
1 -
Please
1 -
Poe
2 -
Poe not working
1 -
Power Outage
1 -
Power Outtage
1 -
Proposed Solution
1 -
R510
2 -
r510 no power
2 -
REBOOT
1 -
Recovery
1 -
Red LED
1 -
Remote access
1 -
Reset ICX username password
1 -
Return
1 -
RMA
3 -
Ruckus
2 -
Ruckus ICX 7150-C12P
4 -
RUCKUS Self-Help
1 -
RUKUS 7150 c12p
1 -
Setup
1 -
Software Recovery
1 -
Solution Proposed
1 -
Solution Proposed warranty
1 -
SPR
1 -
SSH
1 -
Switch
1 -
Telnet
1 -
Unleashed
3 -
Unresolved Issue
1 -
Upgrade
3 -
Upgrading R510
1 -
User Management
1 -
username
1 -
VPN streaming fail proxy not working Amazon prime video
1 -
Wifi
1 -
Wifi6
1 -
Wireless
3
- « Previous
- Next »

