This website uses cookies. By clicking Accept, you consent to the use of cookies. Click Here to learn more about how we use cookies.
RUCKUS Community Forums are now in READ-ONLY mode while we migrate to a new platform.
You will still be able to read posts and knowledge articles, but will be unable to post new content until Go Live on the new platform Monday August 17.
Lennar Smart Home customers: please contact [email protected] for assistance during the week of August 9-17.

- Community
- RUCKUS Technologies
- RUCKUS Lennar Support
- Community Services
- RTF
- RTF Community
- Australia and New Zealand – English
- Brazil – Português
- China – 简体中文
- France – Français
- Germany – Deutsch
- Hong Kong – 繁體中文
- India – English
- Indonesia – bahasa Indonesia
- Italy – Italiano
- Japan – 日本語
- Korea – 한국어
- Latin America – Español (Latinoamérica)
- Middle East & Africa – English
- Netherlands – Nederlands
- Nordics – English
- North America – English
- Poland – polski
- Russia – Русский
- Singapore, Malaysia, and Philippines – English
- Spain – Español
- Taiwan – 繁體中文
- Thailand – ไทย
- Turkey – Türkçe
- United Kingdom – English
- Vietnam – Tiếng Việt
- EOL Products
Turn on suggestions
Auto-suggest helps you quickly narrow down your search results by suggesting possible matches as you type.
Showing results for
- RUCKUS Forums
- RUCKUS Technologies
- RUCKUS One
- suggestion for r1 graphs
Options
- Subscribe to RSS Feed
- Mark Topic as New
- Mark Topic as Read
- Float this Topic for Current User
- Bookmark
- Subscribe
- Mute
- Printer Friendly Page
suggestion for r1 graphs

Options
- Mark as New
- Bookmark
- Subscribe
- Mute
- Subscribe to RSS Feed
- Permalink
- Report Inappropriate Content
11-29-2023 03:25 AM
hello
a suggestion to improve ruckus one portal (and alsto to improve netadmin health 😉)
every graph I see on r1 has a time-window of last 8 hours or last 24 hours, but there is a little glich with the end of the line: it shows the graph till now, even if the cloud did not ingest the data for last 20 minutes jet, so I always see a fall on the numbers at the end of the graph;
example: screenshot taken at 12:06, data are shown till 12:00, but at 12:00 processed data says 0 clients and I feel bad as I think the network is down, maybe for some configuration I modified on r1 😉 (actually there was 61 clients connected at 12:00, but I will see them only after 12:20):
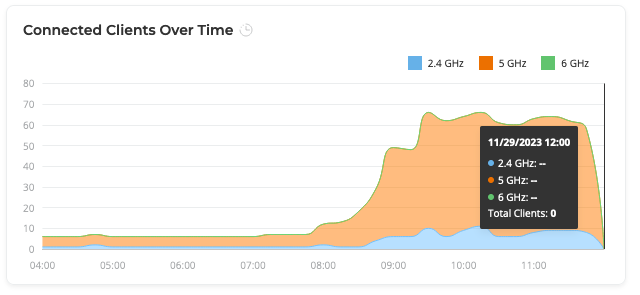
I think it's better to have a graph ending 20 minutes ago, than to have graph with no data at the end 🙂
Reply
1 REPLY 1


Options
- Mark as New
- Bookmark
- Subscribe
- Mute
- Subscribe to RSS Feed
- Permalink
- Report Inappropriate Content
11-29-2023 11:18 AM
Hello @ebi,
Thank you for your feedback and suggestion, we appreciate your effort!
Feedback has been shared with the concerned team.
Syamantak Omer
Sr.Staff TSE | CWNA | CCNA | RCWA | RASZA | RICXI
RUCKUS Networks, CommScope!
Follow me on LinkedIn

Labels
