- Community
- RUCKUS Technologies
- RUCKUS Lennar Support
- Community Services
- RTF
- RTF Community
- Australia and New Zealand – English
- Brazil – Português
- China – 简体中文
- France – Français
- Germany – Deutsch
- Hong Kong – 繁體中文
- India – English
- Indonesia – bahasa Indonesia
- Italy – Italiano
- Japan – 日本語
- Korea – 한국어
- Latin America – Español (Latinoamérica)
- Middle East & Africa – English
- Netherlands – Nederlands
- Nordics – English
- North America – English
- Poland – polski
- Russia – Русский
- Singapore, Malaysia, and Philippines – English
- Spain – Español
- Taiwan – 繁體中文
- Thailand – ไทย
- Turkey – Türkçe
- United Kingdom – English
- Vietnam – Tiếng Việt
- EOL Products
- RUCKUS Forums
- Community Services
- Community and Online Support Services
- Re: SmartZone - Access Points are not joining the ...
- Subscribe to RSS Feed
- Mark Topic as New
- Mark Topic as Read
- Float this Topic for Current User
- Bookmark
- Subscribe
- Mute
- Printer Friendly Page
SmartZone - Access Points are not joining the Default Zone, they are online,
but dashboard info is not refreshing
- Mark as New
- Bookmark
- Subscribe
- Mute
- Subscribe to RSS Feed
- Permalink
- Report Inappropriate Content
05-17-2021 10:07 AM
Hi All,
I am struggling with getting APs connected to the SmartZone, I can see them connected, but their data for example Management VLAN is N/A, Provision Stage N/A, and what is very interesting Last Seen date is always the same as Registered On, which indicate that AP is able to join the scg and then after getting the newest config it drops at some point. I tried different AP models. I did set factory from AP cli then I quickly removed it from SZ GUI and I could see the same behavior. I tried to provision it with csv file as always - did not help.
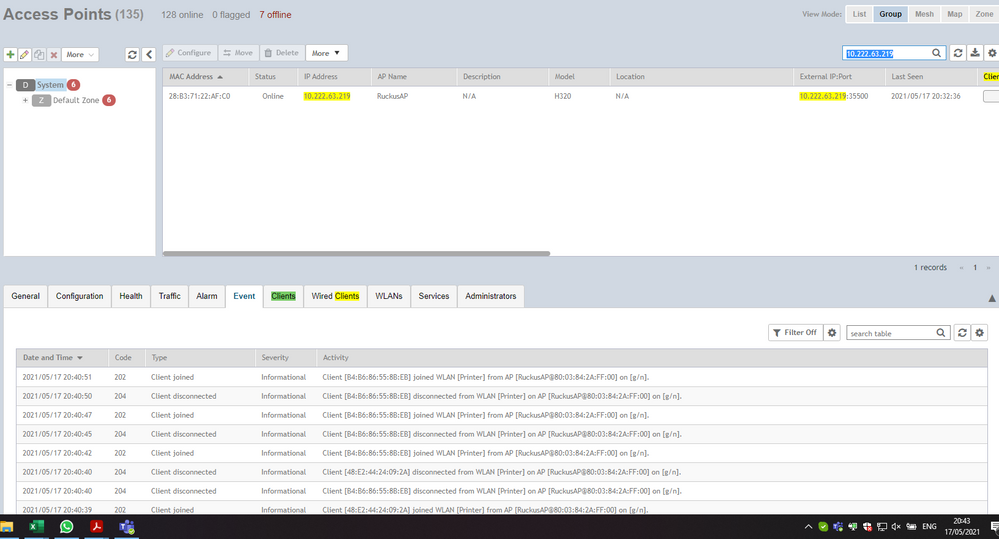
I am able to see all the things in Events section when AP highlighted in dashboard, so why the the rest of the data is not visible in it?
This is what I see:
| AP MAC | AP Name | Description | Status | IP Address | Model | Zone | AP Group | External IP:Port | AP Firmware | Serial | Configuration Status | Last Seen | Location | Administrative State | Registration State | Provision Method | Provision Stage | Registered On | Management VLAN | |
| 28:B3:71:22:AF:XX | RuckusAP | N/A | Online | 10.222.63.219 | H320 | N/A | Room | 10.222.63.219:50709 | 5.1.0.0.595 | 1.92E+11 | Up-to-date | 17/05/2021 17:31 | Unlocked | Approved | Discovered | N/A | 17/05/2021 17:31 | N/A | ||
Cluster made of two SZ-100
FW ver 5.2.2.0.317
AP ver 5.1.0.0.595
If I try to reboot AP via WEBgui it says: 'Unable to reboot the AP. Reason: Failed to execute command on AP !.'
CSV template
| AP Mac Address | Zone Name | Model | AP Name | Description | Location | GPS Coordinates | Logon ID | Password | Administrative State | IP Address | Network Mask | Gateway | Primary DNS | Secondary DNS | Serial Number | IPv6 Address | IPv6 Gateway | IPv6 Primary DNS | IPv6 Secondary DNS | |
| 28:B3:71:22:AF:XX | Default Zone | H320 | APtest | Desc1 | Location1 | admin | pass | 1.92E+11 | ||||||||||||
I can ping APs from my GW, from both SZs,
communication works fine, there are no blocking rules set, it is connected on the same vlan, on SZ VLAN 1 should work at this stage of installation, I will change it later to tagged one.
I have log file from this AP if needed, Also I can send any API to the SmartZones, as I have Postman configured for this purpose already.
Please share your thoughts, I have spent some nights on this issue, I have no more time I guess...
- Mark as New
- Bookmark
- Subscribe
- Mute
- Subscribe to RSS Feed
- Permalink
- Report Inappropriate Content
05-17-2021 11:54 AM
Hi Bart,
Config status shows "Up-to-date" and that indicates AP is fully functioning.
Could you SSH into the AP and run below commands.
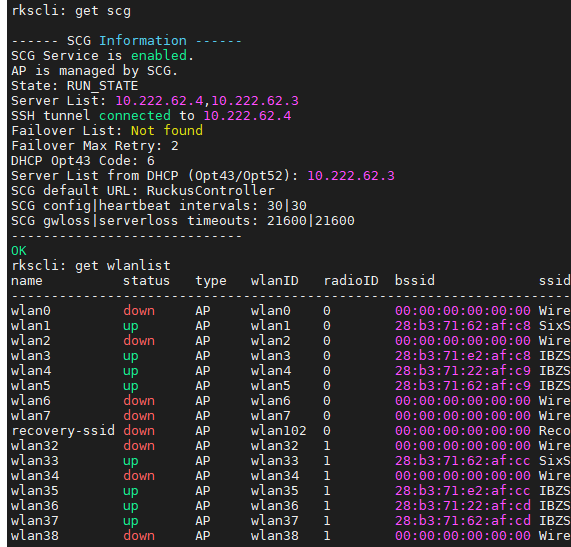
get scg
get wlanlist
Is the AP broadcasting SSID? If yes, are you able to connect?
Since this is a two node cluster, this could be also related to data indexing between the zones.
Make sure latency between these zones is nominal. If AP is functioning and broadcasting SSIDs as well, try to reindex cluster data by running below command on one of the SZs.
enable
debug
reindex-elasticsearch-all
yes
This doesn't required downtime or has any service impact.
Syamantak Omer
Sr.Staff TSE | CWNA | CCNA | RCWA | RASZA | RICXI
RUCKUS Networks, CommScope!
Follow me on LinkedIn
- Mark as New
- Bookmark
- Subscribe
- Mute
- Subscribe to RSS Feed
- Permalink
- Report Inappropriate Content
05-17-2021 12:18 PM
@syamantak_omer Thank you, it worked
- Mark as New
- Bookmark
- Subscribe
- Mute
- Subscribe to RSS Feed
- Permalink
- Report Inappropriate Content
05-17-2021 12:25 PM
Good to know it fixed the issue!
Syamantak Omer
Sr.Staff TSE | CWNA | CCNA | RCWA | RASZA | RICXI
RUCKUS Networks, CommScope!
Follow me on LinkedIn
- Mark as New
- Bookmark
- Subscribe
- Mute
- Subscribe to RSS Feed
- Permalink
- Report Inappropriate Content
05-17-2021 12:53 PM
Unfortunately, I have do not have much luck today...
I am one step ahead as now I can see that all the names, zones and groups are fine, but prov stage and Mgmt vlan have 'N/A' and also Last seen is the time short after that moment of running the command you mentioned above. I tried to reboot and it still shows the same date and time.
I have been waiting 15 mins to see if the APs go offline, but they are not.
I have removed the AP mentioned above and it has been added back after 30s. Again without Default Zone, Group,
.3 is SZ01 .4 is SZ02 /DHCP from server on the same subnet

Please compare, 'Last seen' with Events data,

-
Access points
1 -
administration
1 -
AP Management
1 -
API Help
1 -
Code Flash Free Space = 0
1 -
community
2 -
ios
1 -
mac
1 -
port-fast
1 -
portfast
1 -
R500
1 -
R750
1 -
Ruckus
2 -
spanning-tree
1 -
spanningtree
1 -
top contributors
1 -
ubuntu
1 -
Unleashed
2
- « Previous
- Next »

