This website uses cookies. By clicking Accept, you consent to the use of cookies. Click Here to learn more about how we use cookies.
- Community
- RUCKUS Technologies
- RUCKUS Lennar Support
- Community Services
- RTF
- RTF Community
- Australia and New Zealand – English
- Brazil – Português
- China – 简体中文
- France – Français
- Germany – Deutsch
- Hong Kong – 繁體中文
- India – English
- Indonesia – bahasa Indonesia
- Italy – Italiano
- Japan – 日本語
- Korea – 한국어
- Latin America – Español (Latinoamérica)
- Middle East & Africa – English
- Netherlands – Nederlands
- Nordics – English
- North America – English
- Poland – polski
- Russia – Русский
- Singapore, Malaysia, and Philippines – English
- Spain – Español
- Taiwan – 繁體中文
- Thailand – ไทย
- Turkey – Türkçe
- United Kingdom – English
- Vietnam – Tiếng Việt
- EOL Products
Turn on suggestions
Auto-suggest helps you quickly narrow down your search results by suggesting possible matches as you type.
Showing results for
- RUCKUS Forums
- RUCKUS Technologies
- Access Points
- how to read log analysis tool "clients sections"
Options
- Subscribe to RSS Feed
- Mark Topic as New
- Mark Topic as Read
- Float this Topic for Current User
- Bookmark
- Subscribe
- Mute
- Printer Friendly Page
how to read log analysis tool "clients sections"
Options
- Mark as New
- Bookmark
- Subscribe
- Mute
- Subscribe to RSS Feed
- Permalink
- Report Inappropriate Content
12-10-2015 05:04 AM
Hi,
I am new to the ruckus, and I need an information about the log.
I need to know about the interval time about client uptime and any others detail about my client behavior.
Below I've just found it the ruckus support website which it has a tool to create a few report about the AP or ZD. Here is the link I use https://loganalyzer1.ruckuswireless*com/Rowdy/
So, lucky to find that tools. Thank you for the support.
But I have a question about it. I really know how to read the log, especially for clients log.
Is there any help/guide so I can be able to read the log?
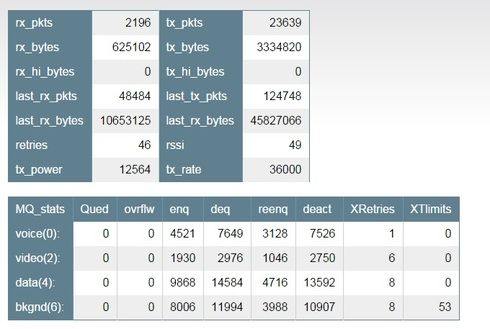
I still don't know how to exactly read the detail about the log information, like below:

May I get the answer?
Thank you,
I am new to the ruckus, and I need an information about the log.
I need to know about the interval time about client uptime and any others detail about my client behavior.
Below I've just found it the ruckus support website which it has a tool to create a few report about the AP or ZD. Here is the link I use https://loganalyzer1.ruckuswireless*com/Rowdy/
So, lucky to find that tools. Thank you for the support.
But I have a question about it. I really know how to read the log, especially for clients log.
Is there any help/guide so I can be able to read the log?
I still don't know how to exactly read the detail about the log information, like below:

May I get the answer?
Thank you,
1 REPLY 1
Options
- Mark as New
- Bookmark
- Subscribe
- Mute
- Subscribe to RSS Feed
- Permalink
- Report Inappropriate Content
12-10-2015 11:18 AM
The top is Transmit and Receive packets specific to your wireless client, so I think you might
appreciate greater explanation of the four QOS stacks and what the columns stand for and mean.
AP CLI command: get mqstats.
Client media queue and station information, in packets, accumulated
since STA associates and discarded when client roams.
# enq = original data packets queued for transmission. # deq = the number of packets
transmitted. # reenq = number of packets
that are attempted to be transmitted again (re-enqueued). # deact is related to transmission
scheduling, and is not meaningful.
qued: # of packets currently in
this queue. Will usually be 0 but sometime you can catch it with a few
packets.
ovrflw: # packets dropped from tail of
queue due to the queue being ‘full’ (at the max limit for this packet class)
enq: # of packets enqueued to the tail
of the queue
deq: # of packets dequeued from the head
of the queue (includes retries)
reenq: # of packet re-enqueued to head
of the queue (due to retries)
deact: # of times this queue was
deactivated from the scheduler due to being empty (usually not important)
XRetries: # of packets dropped due
to excessive number of retries (usually 20).
--- MQ Stats ---
-- wlan0 --
STA:
00:40:96:a8:f7:86 AID:1
-----------------------------------------------------------------------------------
Qued ovrflw enq
deq reenq deact
XRetries XTlimits AirtimeCrd
voice(0) X: 0
0 118 166 48 166 0 0
4000
video(2) X: 0
0 316 479 163
6115 0 0
44
data(4) X: 0
0 201 322 121
2875 0 0
4000
bkgnd(6) X: 0
0 1601 2134 533
7556 1 68
3880
XTlimits indicates how many times packets exceeded the
holding time limit. If the AP can't dequeue the packet before holding time
expires (these holding time limits are different for different types of traffic
meaning, data, background, video, voice) it will drop it.
XTlimit value is significant in the support info. All queue columns showing
some major figures, usually indicates too much interference or too much
incoming data from the wire side.
Look for too much broadcast traffic on the network, and how big is the
broadcast domain, and what type of clients are on the network?
If interference on the radio band doesn’t look bad, it may be wire traffic
driving client queue limits to max.
Labels
-
Access points
1 -
AP Controller Connectivity
2 -
AP Management
6 -
AP migration
1 -
Authentication Server
1 -
cli
1 -
Client Management
2 -
Firmware Upgrade
2 -
Guest Pass
1 -
I live in
1 -
Installation
3 -
IP Multicast
1 -
mounting
1 -
Poe
3 -
Proposed Solution
2 -
R320 SLOW SPEED
1 -
R550
1 -
R610
1 -
R650
2 -
R750
2 -
Ruckus
1 -
Security
1 -
SmartZone
1 -
Solution Proposed
2 -
SSH
1 -
T710
1 -
Unleashed
1 -
User Management
1 -
Wireless Throughput
1 -
WLAN Management
2 -
ZoneDirector
1
- « Previous
- Next »

