This website uses cookies. By clicking Accept, you consent to the use of cookies. Click Here to learn more about how we use cookies.
- Community
- RUCKUS Technologies
- RUCKUS Lennar Support
- Community Services
- RTF
- RTF Community
- Australia and New Zealand – English
- Brazil – Português
- China – 简体中文
- France – Français
- Germany – Deutsch
- Hong Kong – 繁體中文
- India – English
- Indonesia – bahasa Indonesia
- Italy – Italiano
- Japan – 日本語
- Korea – 한국어
- Latin America – Español (Latinoamérica)
- Middle East & Africa – English
- Netherlands – Nederlands
- Nordics – English
- North America – English
- Poland – polski
- Russia – Русский
- Singapore, Malaysia, and Philippines – English
- Spain – Español
- Taiwan – 繁體中文
- Thailand – ไทย
- Turkey – Türkçe
- United Kingdom – English
- Vietnam – Tiếng Việt
- EOL Products
Turn on suggestions
Auto-suggest helps you quickly narrow down your search results by suggesting possible matches as you type.
Showing results for
- RUCKUS Forums
- Community Services
- Community and Online Support Services
- Ruckus SmartZone 100 Version 3.6.2.0.78 - 'Airtime...
Options
- Subscribe to RSS Feed
- Mark Topic as New
- Mark Topic as Read
- Float this Topic for Current User
- Bookmark
- Subscribe
- Mute
- Printer Friendly Page
Ruckus SmartZone 100 Version 3.6.2.0.78 - 'Airtime Detail' button BUG
Options
- Mark as New
- Bookmark
- Subscribe
- Mute
- Subscribe to RSS Feed
- Permalink
- Report Inappropriate Content
10-25-2018 08:32 AM
I have a problem with my SZ100.
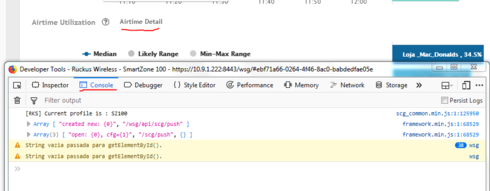
I was trying to see pie chart in Dashboard > Performace > Airtime Utilization > Button 'Airtime Detail', but after click the button, nothing happens, so i started to debug this button on console log
i ́ve used mozila developer tools.
See image before click the button:

See now after click the button:

only for info, i've checked it in the Chrome and Mozilla, and also checked if framework.min.js was there.
Seem a bug or a programming issue, can some one help?
I was trying to see pie chart in Dashboard > Performace > Airtime Utilization > Button 'Airtime Detail', but after click the button, nothing happens, so i started to debug this button on console log
i ́ve used mozila developer tools.
See image before click the button:

See now after click the button:

only for info, i've checked it in the Chrome and Mozilla, and also checked if framework.min.js was there.
Seem a bug or a programming issue, can some one help?
1 REPLY 1
Options
- Mark as New
- Bookmark
- Subscribe
- Mute
- Subscribe to RSS Feed
- Permalink
- Report Inappropriate Content
10-26-2018 06:28 AM
I suggest you open a TAC case to get to the bottom of this.
Labels
-
Access points
1 -
administration
1 -
AP Management
1 -
API Help
1 -
Code Flash Free Space = 0
1 -
community
2 -
ios
1 -
mac
1 -
port-fast
1 -
portfast
1 -
R500
1 -
R750
1 -
Ruckus
2 -
spanning-tree
1 -
spanningtree
1 -
top contributors
1 -
ubuntu
1 -
Unleashed
2
- « Previous
- Next »

