- Community
- RUCKUS Technologies
- RUCKUS Lennar Support
- Community Services
- RTF
- RTF Community
- Australia and New Zealand – English
- Brazil – Português
- China – 简体中文
- France – Français
- Germany – Deutsch
- Hong Kong – 繁體中文
- India – English
- Indonesia – bahasa Indonesia
- Italy – Italiano
- Japan – 日本語
- Korea – 한국어
- Latin America – Español (Latinoamérica)
- Middle East & Africa – English
- Netherlands – Nederlands
- Nordics – English
- North America – English
- Poland – polski
- Russia – Русский
- Singapore, Malaysia, and Philippines – English
- Spain – Español
- Taiwan – 繁體中文
- Thailand – ไทย
- Turkey – Türkçe
- United Kingdom – English
- Vietnam – Tiếng Việt
- EOL Products
- RUCKUS Forums
- RUCKUS Technologies
- Access Points
- Health Check for ZoneDirector Controller
- Subscribe to RSS Feed
- Mark Topic as New
- Mark Topic as Read
- Float this Topic for Current User
- Bookmark
- Subscribe
- Mute
- Printer Friendly Page
Health Check for ZoneDirector Controller
- Mark as New
- Bookmark
- Subscribe
- Mute
- Subscribe to RSS Feed
- Permalink
- Report Inappropriate Content
07-30-2015 12:01 AM
- Mark as New
- Bookmark
- Subscribe
- Mute
- Subscribe to RSS Feed
- Permalink
- Report Inappropriate Content
07-30-2015 03:16 AM
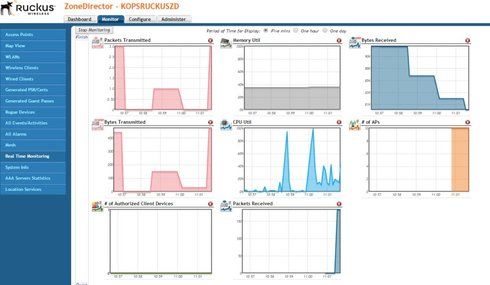
In ZD gui go to:
monitor
real time monitoring
choose start/stop and a time value (screenshot below)

I haven't heard of any particular values to be considered good because it will depend on how many access points and how many clients (for instance) you are supporting.
Bad would be 100% and time to consider an upgrade or find out why you ZD is stressed.
If your ZD responds sluggishly or feels "slow" then you know it's working hard and the monitoring tab will only give you pretty pictures to confirm this!
Rather like task manager in windows you get a feel for the numbers and what's normal rather than going by hard and fast rules.
NOTE: I seem to remember (from a comment by tech staff) that actually using the monitoring tool was quite cpu/memory intensive so do not leave it running in background unless you have a good reason.
- Mark as New
- Bookmark
- Subscribe
- Mute
- Subscribe to RSS Feed
- Permalink
- Report Inappropriate Content
07-30-2015 06:57 AM
We monitor CPU and
memory utilization with cacti (a related topic for cacti monitoring https://forums.ruckuswireless.com/ruckuswireless/topics/anyone_using_cacti )
In the past with a ZD3k we’ve set an alarm threshold for the CPU utilization of 60%, relative to the load we had.
It depends on how many APs you use and the load (in terms of number of clients). In our case (multiple SSIDs, 2 802.1X SSIDs, DVLAN) the CPU of ZD3k spiked at 90%-100% several times with 6k simultaneous clients, 450APs, resulting in ZD unresponsive. These numbers were less than the theoretical limits of 1k APs and 10k clients for ZD3k. Since we changed to a ZD5k, the CPU did not went above 15%.
We also did a http health check for the ZD web interface (script which sends an alarm if the ZD url is unresponsive).
-
Access points
1 -
AP Controller Connectivity
2 -
AP Management
6 -
AP migration
1 -
Authentication Server
1 -
cli
1 -
Client Management
2 -
Firmware Upgrade
2 -
Guest Pass
1 -
I live in
1 -
Installation
3 -
IP Multicast
1 -
mounting
1 -
Poe
3 -
Proposed Solution
2 -
R320 SLOW SPEED
1 -
R550
1 -
R610
1 -
R650
2 -
R750
2 -
Ruckus
1 -
Security
1 -
SmartZone
1 -
Solution Proposed
2 -
SSH
1 -
T710
1 -
Unleashed
1 -
User Management
1 -
Wireless Throughput
1 -
WLAN Management
2 -
ZoneDirector
1
- « Previous
- Next »

